![]() More about
More about
the Portal
on the STHC
websiteThis STHC Data Portal contains the next generation of School Travel Health Check analysis output. All the data tables, charts and maps previously spread between different file types - Excel spreadsheets, MapInfo GIS, Instant Atlas, Google Earth etc. - are now delivered through this single, interactive web portal, which is viewable in any HTML5 compatible browser (including mobile devices).
Through this portal the STHC analysis results are made as publicly accessible as possible, but with password protection granting variable levels of viewing rights where it is absolutely required.
As always we welcome feedback on how this STHC Data Portal can be further improved to enhance joined-up working within your local authority, as well as provide learning & management resources for schools and the communities they serve.
Scroll down to find out more about the background, analysis modules and components it currently contains, the reporting levels, log-in requirements, browser compatibility, responsive layout, incorporated free web-services and applications & benefits of the School Travel Health Check Data Portal.
Background
Although it is grounded in spatial analysis using sophisticated GIS tools, the ultimate purpose of the STHC is to provide users with actionable intelligence information, which means it needs to be easily digestible by non-spatial specialists. Thus tables and charts have always formed the core of the output as well as maps.
When the STHC first began in 2005 however all the output had to be spread between different "stand alone" files - Excel spreadsheets, MapInfo GIS, Instant Atlas, Google Earth etc. This was because the technical capability to deliver them online, all in the one place, at a cost that could be afforded by local authorities, did not yet exist.
The STHC Data Portal was first rolled out to customers in 2013. As you can see by the fact that some modules are in [Beta] development, it has been continually evolving ever since.
Analysis Modules
The STHC Data Portal is arranged into pages contained within different modules, themed by the specific purpose and nature of the analysis (though there may be some overlap between them in terms of the data reported). Additional modules may be added over time, but currently these are:-
Pupil Travel Distance & Mode Analysis Module
The foundation of the STHC output since its' beginning, this module quantifies & visualises how far pupils travel to school, by what mode, and the carbon & calorie footprints of the journeys (if pupil usual mode of travel data has been supplied by the school).
Proximity & Pupil Choice Analysis Module [BETA]
This module quantifies & visualises the proximity of schools to their pupils, pupils to their nearest schools, and schools to each other, as well as "what if.." scenarios (eg. "what if all pupils went to their nearest school?").
**This module is still in [BETA] development. We need your feedback & suggestions to help us develop it further for the benefit of all.**
Road Traffic Accident (STATS 19) Data Analysis Module [BETA]
This module shows details of all the reported personal injury road accidents that have taken place in the local authority area on public roads with respect to schools. Data is taken from the STATS19 official accident reporting system used by the police.
**This module is still in [BETA] development. We need your feedback & suggestions to help us develop it further for the benefit of all.**
Note - Within each module section on the home page you will find buttons that link to each page of analysis output within the module. You can also use the menu at the top of the page. Both the buttons and top menu navigation options are available on every page on the portal.
Portal Components
STHC analysis results are visualised in various ways within the portal:-
| Maps |
| Based on Google maps (so Street View functionality is also built-in), these can be interactively filtered by various analysis-appropriate criteria. |
| Headline Statistics |
| Key results in an "infographic" style. |
| Charts |
| Bar Charts show results for the latest analysis year, Line Charts show results for all available years. |
| Tables |
| These can be interactively filtered by various analysis-appropriate criteria and then re-ordered by individual columns. |
| Geo-statistical Atlases |
| These interactively combine maps, charts and tables so you can carry out more detailed comparison results between individual schools as well as those for the authority as a whole. |
| Reports |
| All the relevant maps, tables and charts compiled into a single, "print-friendly" webpage. |
Note - Each page in the portal has an introduction section, a short page walk-through video and "Questions for Debate" so users can quickly learn what it shows and what they should be looking for when it comes tot heir school.
Reporting Levels
The STHC analysis results are reported at various 'levels' on each page of the portal:-
| Individually selected school on its own |
| One only of |
| Just the data for the school that has been selected from the drop-down list or a map, along with the results for all schools in the authority as a whole for comparison. |
| All schools side-by-side for comparison |
| Every one of |
| Results for all individual schools on the one page so they can be compared with each other and ranked. |
| All schools by phase |
| Total of |
| See how key analysis results compare between different educational phases of school (primary etc.), and individual schools within that phase. |
| All schools |
| Total of |
| Total figures for all schools aggregated together as a whole. |
| Latest year analysed only |
| In pages that deal with data about only one school year this will be the most recent year analysed by us. (As we are dealing with school census data, there is an inevitable delay between its collection at source within schools and supply to us by the local authority for analysis.) |
| All available years |
| See the whole history of analysis results to see individual years as well as trends. |
Log-in Requirements
Through this portal the STHC analysis results for an authority are made as publicly accessible as possible. However as pupil-level data is involved there is a need to balance universal availability with data protection issues, such as ensuring anonymity. To that end some pages will require users to be logged-in to the portal in order to see more sensitve, pupil-level data. These will be indicated by the Log-in prompt in the menu bar.
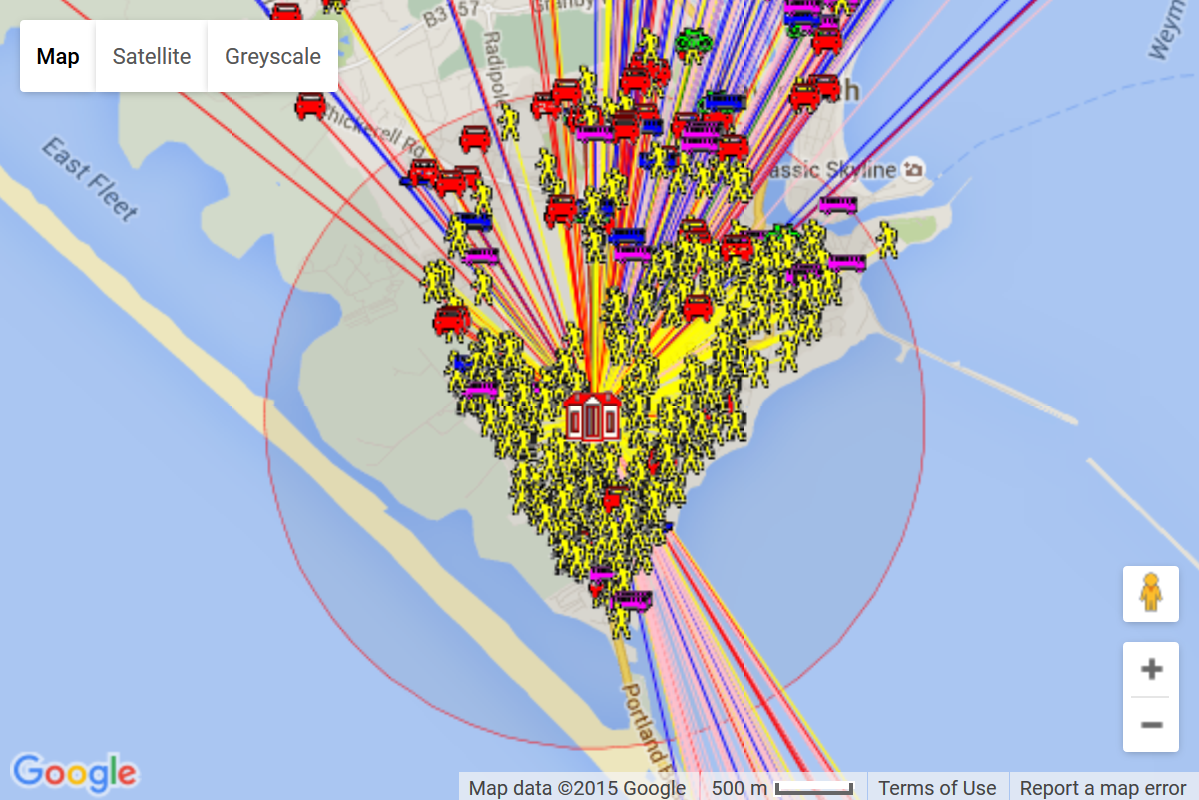
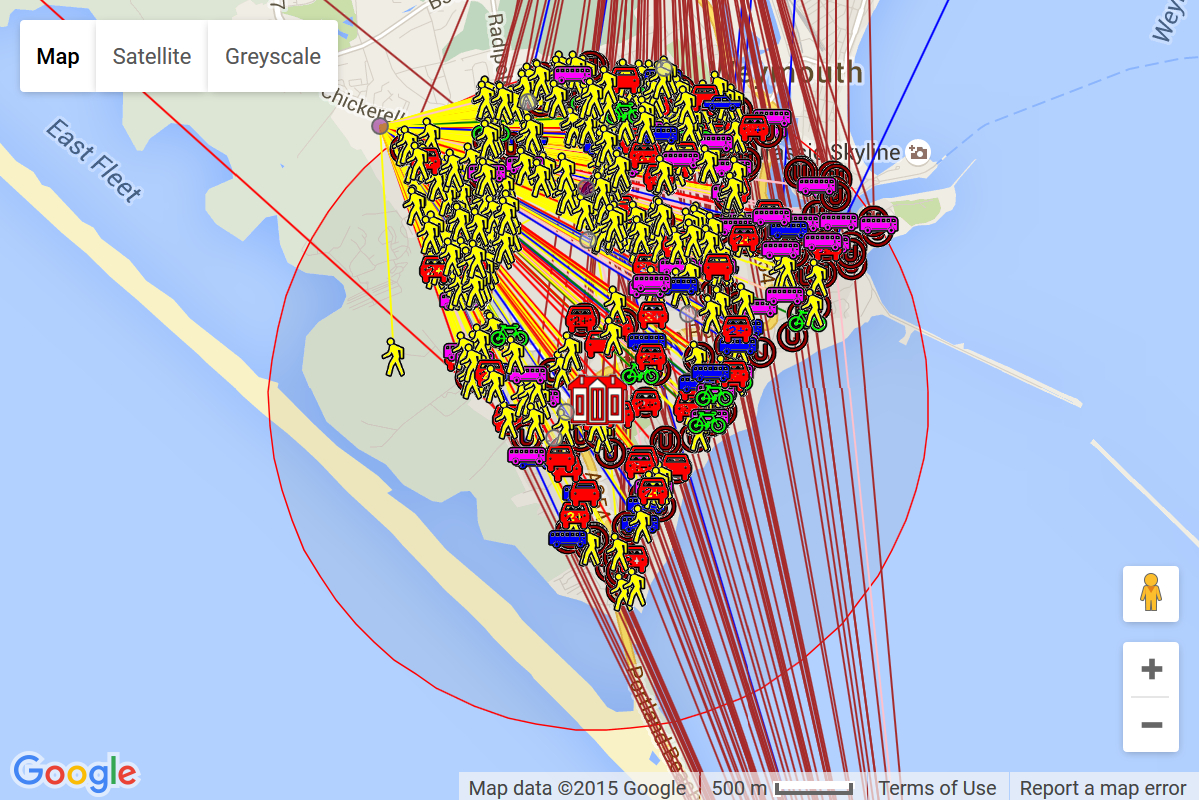
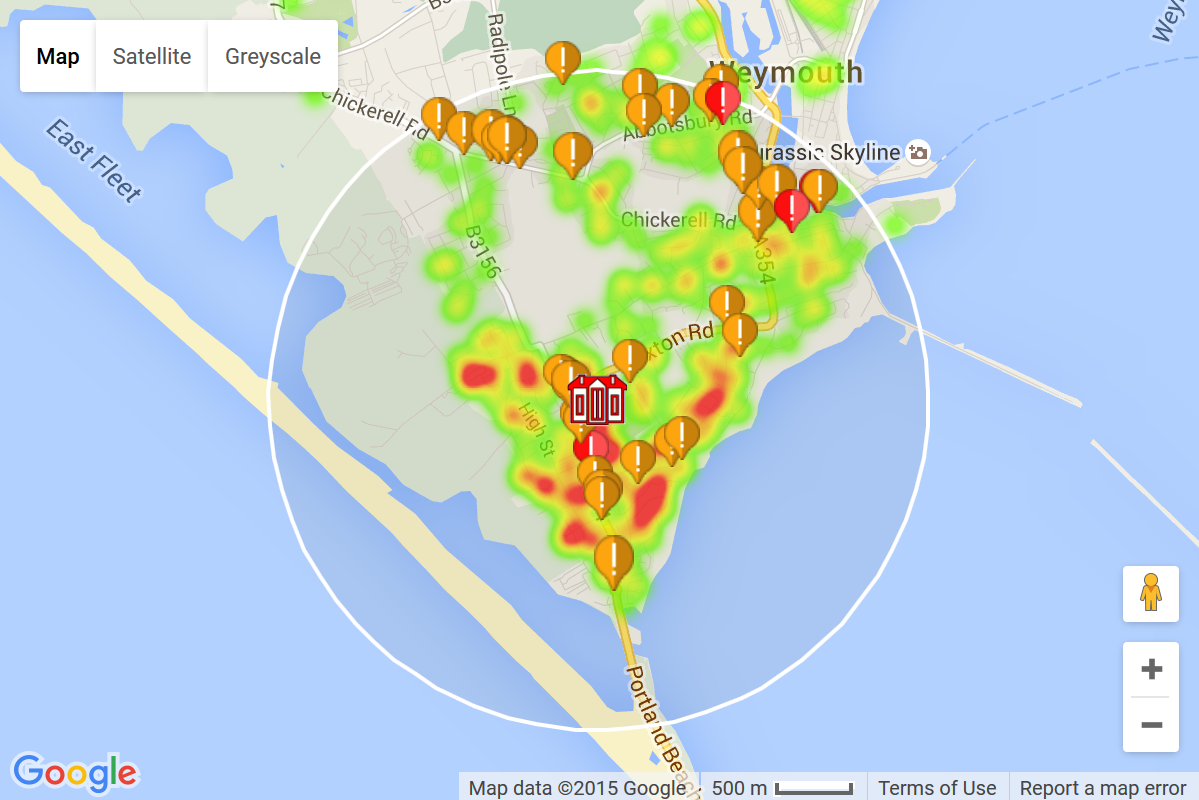
For example map pages involving individual pupil-level data will be shown as an anoymised "hot-spot" style map by default (below left). Once users have logged in they will have the option to also see the map as individual pupil icons & lines of travel (below right).
Note - Log-in account details will have been provided to each school in the latest STHC pack that was sent out. Authority officers can also apply for a login. Please get in touch via the "Contact Us" link in your authorities portal menu if you require any assistance with logging in.
Browser Compatibility
The dynamic features of this portal - the maps and charts and some formatting elements - will only be displayed properly if your internet browser is HTML5 compatible. This shouldn't be a problem for most users but (as usual) the main issues are with Internet Explorer, especially older versions. Alas there is no way round this, apart from updating to a more modern browser.
Responsive ('Fluid') Page Layout
The page design is "fluid", which means elements will move about depending on a combination of screen size, browser window width and browser zoom settings. By using a fluid design the content can be seen more easily in mobile devices such as smart phones and tablets, which have smaller screens than computers. Users should experiment to optimise the view for their set-up.
Incorporated Free Web-Services
The portal incorporates free web-services provided by external providers such as Google Maps and GoogleCharts as integral components. These provide a great free technical resource that greatly enhance visualisation of the data at no extra cost to users - what better tool is there for visualising a journey than actually viewing it in StreetView within the Google Maps window?
However it means that the users' device must have an active internet connection in order for the portal to work properly (although their is no problem with the HTML page files themselves sitting on the device). Also these external web-services are not within our control and so we ask users to please be patient as some pages, or some elements within a page, may take noticeably longer to load at peak Internet usage times.
Applications & Benefits
The STHC Data Portal benefits stakeholders in many ways:-
The STHC quantifies and visualises the actual pupil travel situation for all schools at both a collective and individual level, over a prolonged period of time, in a consistent way.
As it has been repeated every school year since 2007-08, the STHC analysis results have built up into a robust evidence base that helps to inform the strategic planning & funding of modeshift-supporting services & infrastructure.
The STHC enables officers to engage simultaneously with all schools across an authority at an operational level, in a consistent, meaningful & constructive way, whether or not they actually collect pupil usual mode of travel (or have a travel plan), using their own data.
The STHC enables the debate around the important issues of active & sustainable travel within a school community to be based on the actual situation "on the ground", not speculative presumption and tabloid style, “knee-jerk” opinion.
The STHC provides both the "big picture" required at the strategic planning level, whilst still being detailed enough to enable resource targetting at the operational level.
The STHC identifies the schools where behaviour-changing shift to more active and sustainable modes of travel on the "school run" is more likely to be achievable, and so resources can be targetted better.
The STHC enables schools to set local SMART* targets (*Sustainable, Measurable, Achievable, Realistic and Time-bound) to deliver modeshift "on the ground" in the short, medium and longer term.
Annual STHC analysis shows how much progress is being made and quantifies how well SMART targets are being met.
![]() More about
More about
the Portal
on the STHC
websiteFurther information on the STHC Data Portal can be found main STHC website, which can also be accessed from the "STHC" menu at the top of every page. (You can see some of our service stats at the bottom of the page).