Standard STHC Analysis Output - School Reports & Covering Letter
The School Travel Health Check Report and accompanying covering letter produced for each school in the LEA are perhaps the most publicly tangible and immediately useful output from our analysis process. Carefully selected excerpts from the Analysis Output Data are incorporated into a bespoke Word file that is created for each school by mail merge between the analysis database and a standard template file that has been adapted (within reason) to include the authority specific logo and amended text.
The report consists of the following components:-
Note: A sample STHC report can be obtained from our Download page...
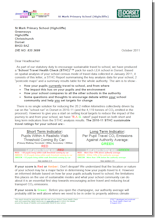

Covering Letter
This is addressed to the school marked for the attention of the head teacher to enable reports to be put in envelopes and immediately posted to all schools via the authority internal mailing system once printed off. As regards the actual content itself, the standard letter template we provide puts the accompanying STHC report in context as well as allowing for pertinent, authority-specific content
to be included like urls of further resources and the names and details of individuals that the school needs to contact for further information. The overall sustainable travel rating for the school is also included (Green is >10% below authority average; Amber is within 10% of authority average; Red is >10% above authority average), however there are also suggestions on what schools should do next for each rating to keep the overall tone as positive as possible.
Clients can of course adapt the letter as they see fit e.g. discussing how the STHC fits in with their own overall service delivery to schools.
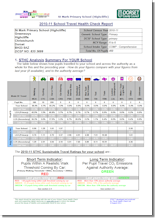
Analysis Stats
The key results of our analysis are listed on the first two pages of the report:-
- Table with mode of travel breakdown for school plus authority average
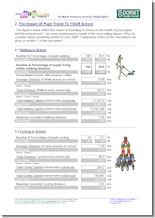
- “Walking & Cycling” stats:-
- number & percentage of pupils living within walking distance (800m Primary, 2000m Secondary)
- total distance walked/cycled every school day
- total calories burned every school day/year as a result
- “Car” stats:-
- number & percentage of pupils being driven from within walking distance (800m Primary, 2000m Secondary)
- total distance driven every school day
- total CO2 emitted every school day/year as a result
- average cost of driving this distance to parent/carer
- Bus Stats
- Overall annual carbon footprint for the school for all modes of travel:-
- Total CO2 emitted by school
- Average CO2 emitted per pupil
- Authority average CO2 emitted per pupil
- Questions to inform debate around sustainable travel within the school community
- Suggestions for short, medium and longer term target setting to achieve modal shift
- Suggestions on how the STHC report can be used across the curriculum by the school
- How the CO2 emission and "total pupil car kilometres" situation would be improved if all pupils attended their nearest school
- Explanation of how the analysis data was calculated, including the official sources of all the "carbon and calorie" factors used
- Suggested further resources
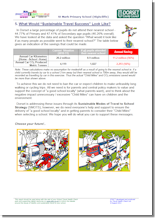
Suggestions For What To Do Next
“Starters for ten” on how the school can use the STHC report to at least begin the process of encouraging more sustainable travel to the school:-
- Questions to inform debate around sustainable travel within the school community
- Suggestions for short, medium and longer term target setting to achieve modal shift in the school
- Suggestions on how the STHC report can be used across the curriculum by the school
Moving To A Lower Carbon Future
One of the consistent features that our analysis uncovers is the large discrepancy between the total distances currently travelled by pupils to their chosen school and the distance they would travel if they went to their nearest eligible school (based on their national curriculum year). The latter figure represents the minimum possible total travel distance for all pupils for the current situation, and hence gives a realistic upper figure for how much can be achieved. This section in the report tabulates the “hard figures” for this difference for the authority, expressed in both kilometres and kilograms of CO2 emitted, by way of highlighting the significant contribution that choice makes to the overall total child miles for school travel.
In all authorities analysed to date the total distance travelled by car would be reduced by over 55% if all pupils attended their nearest school – and that’s without taking into account any modeshift as a result of attending a closer school).
Explanation of Calculations
This section gives the sources of the various factors used in our analysis calculations. We try to use “definitive” figures wherever possible in our analysis, Thus the carbon factors used to turn travel distances into CO2 emissions are those issued by DEFRA, whilst the “calorie factors” are taken from the work of Roger Mackett, a professor of Transport Studies at University College London and one of the UKs’ leading researchers into the role of travel as a facilitator for children’s health.
Recommended Further Resources
The final section of the report lists resources to further help the school investigate and debate the issues raised by the STHC.